Excel Charts
Excel Charts are visual presentation of data to enhance the presentation and easy to understand. You can create different types of Excel Charts such as line chart, column chart, bar chart, pie chart, surface chart etc.
How to Make Excel Charts?
To create an Excel Chart, follow the below steps:
- Step 1: Select the Data (or keep the cursur anywhere in the table) from which you want to create a chart in Excel.

- Step 2: Go to Insert tab and click on Recommended Charts. Select a chart type on the Recommended Charts tab or All Charts tab to preview the chart in Excel.

Or click the specific chat from the Charts group (for example, column or bar chart as shown below) to insert in Excel.

- Step 3: Click OK to insert the chart in Excel.
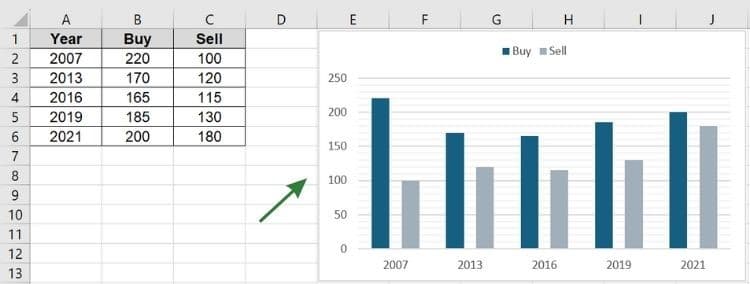
How to Move Excel Chart to a New Worksheet?
You can easily move the Excel chart by drag and drop or cut, copy and paste method within the worksheet and to a different worksheet. But there is a better way to move the chart to a new worksheet in Excel by following the below steps:
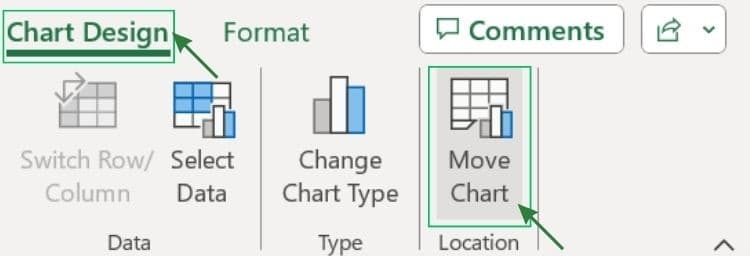
- Step 1: Click anywhere in the Chart. Go to Chart Design Tab and click on Move Chart under the Location group.
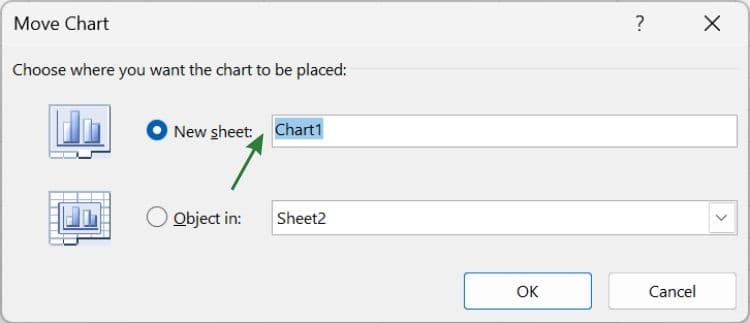
- Step 2: Click New sheet and give the Sheet Name (e.g Chart1) to move the Chart to a new worksheet.
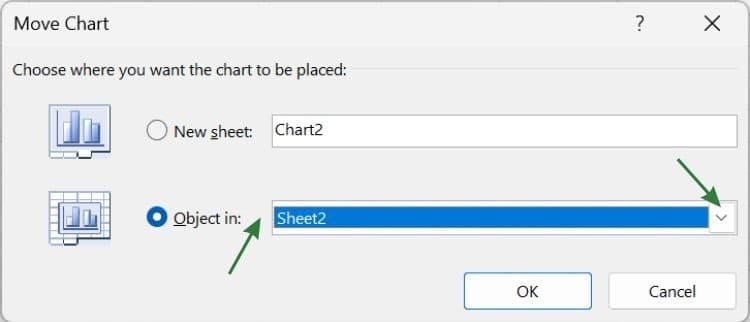
- If you want to move the Excel Chart to an existing another worksheet then, click on Object in and select the Sheet Name from the dropdown list (e.g Sheet2).
How to Change Styles in Excel Charts?
To change the Excel Chart Styles, follow the below steps:
- Step 1: Click anywhere in the chart.
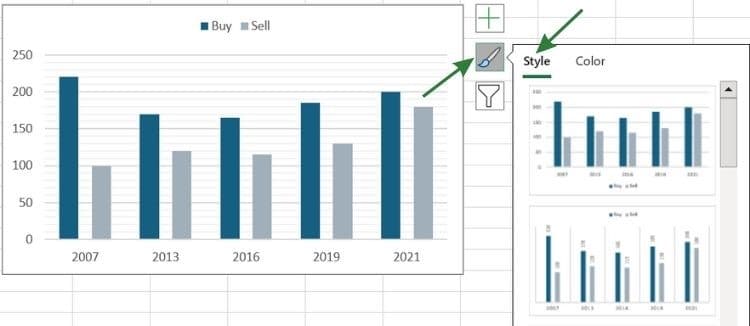
- Step 2: Go to Chart Design and select the styles under the Chart Styles group.

Or, go to upper right corner of the Chart and click on Chart Style as shown below:
How to Change Colors in Excel Charts?
To change the Excel Chart Colors, follow the below steps:
- Step 1: Click anywhere in the chart.
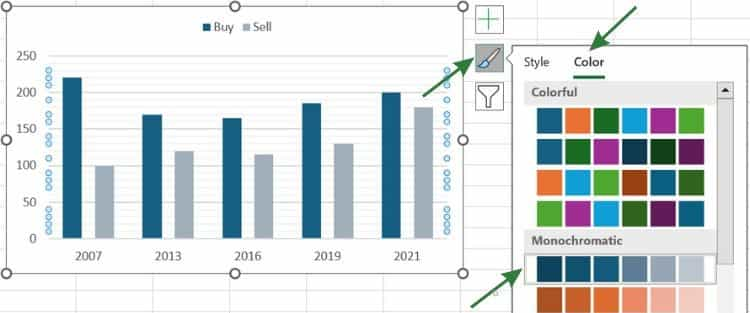
- Step 2: Go to Chart Design and select the Colorful Palette or the Monochromatic Palette under the Change Colors.

Or, go to upper right corner of the Chart and click on Chart Color as shown below:
Or, go to Page Layout tab and select the Colors under the Themes group.

What are the Different Types of Excel Charts?
The different types of Charts in Excel are:

Excel Tutorial Part 1 (Basic)
» Excel Home
» Excel Basics
» Excel Workbook
» Excel Template
» Excel Cell
» Excel Password
Excel Tutorial Part 2 (Format)
» Excel Clipboard
» Excel Format Font
» Excel Format Alignment
» Excel Format Number
» Excel Border
» Excel Conditional Formatting
Excel Tutorial Part 3 (Data)
» Excel Sort Data
» Excel Filter Data
» Excel Text to Columns
» Excel Data Validation
» Excel Flash Fill
» Excel Remove Duplicates
» Excel Relationships
» Excel Consolidate
» Excel What-If Analysis
» Excel Group
» Excel Charts
» Excel Table
» Excel PivotTable
Excel Tutorial Part 4 (Find)
» Excel Find and Replace
» Excel Go To
» Excel Select Objects
» Excel Selection Pane
Excel Tutorial Part 5 (Review)
» Excel Spell Check
» Excel Smart Lookup
» Excel Translate
» Excel Comments & Notes
» Excel Protect
» Excel Hide Ink
» Excel Clipboard
Excel Tutorial Part 6 (View)
» Excel Workbook Views
» Excel Formula Bar
» Excel Zoom
» Excel Window
» Excel Macros
Excel Tutorial Part 7 (Fx)
» Excel Formulas (Category)
» Excel Formulas (Alphabetical)
» Excel Errors
» Excel Name Manager
» Excel Formula Auditing
» Excel Watch Window
» Excel Calculation Options
Excel Tutorial Part 8 (Other)
» Excel Add-ins
» Excel Shortcuts
